Baseline Aircraft
Build and fly a baseline, then use analysis to guide the redesign.
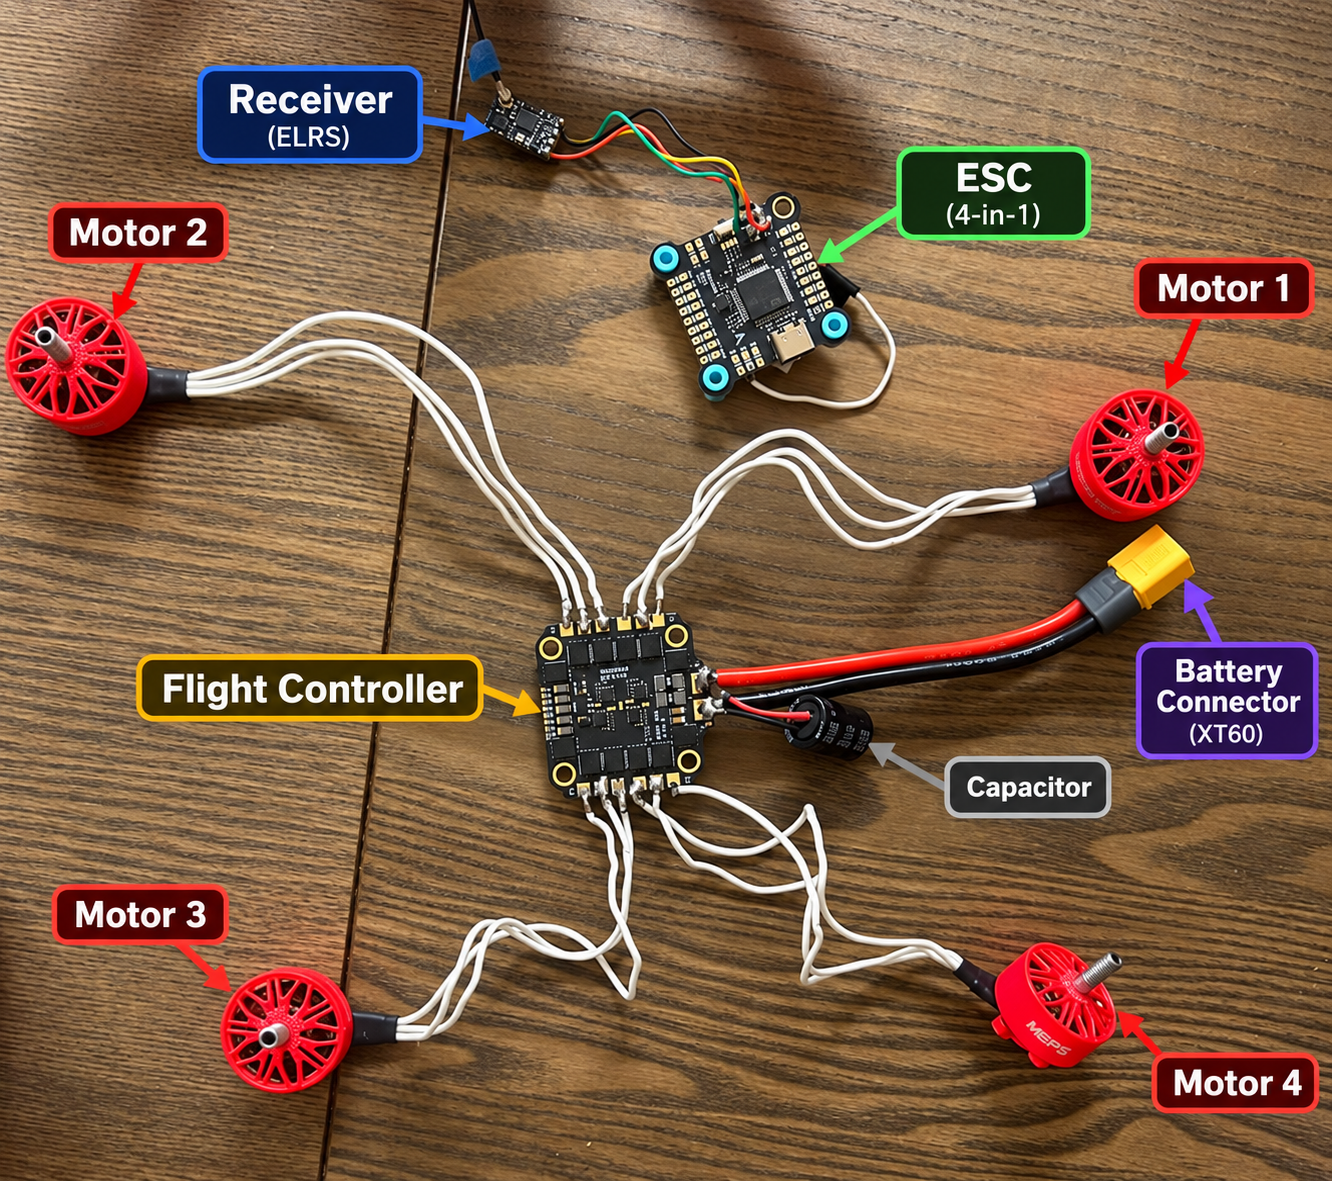
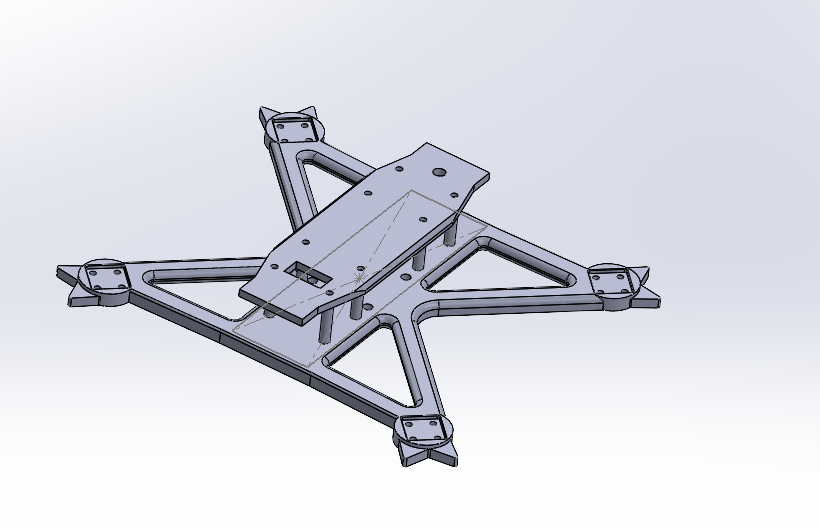
I started with an existing 3D-printable quadcopter frame from Thangs, printed it in PLA, and assembled the aircraft from individual propulsion, electronics, and flight-control components. The original frame was not my design; it provided the starting point for the engineering study.
After modeling the aerodynamic loading and analyzing the structure, I successfully flight-tested the baseline drone. I then used topology optimization to guide a new manufacturable frame, reanalyzed it, printed and assembled it, and successfully flew the redesigned aircraft.
CFD & Structural Loading
Translate propeller-induced airflow into a frame pressure load.
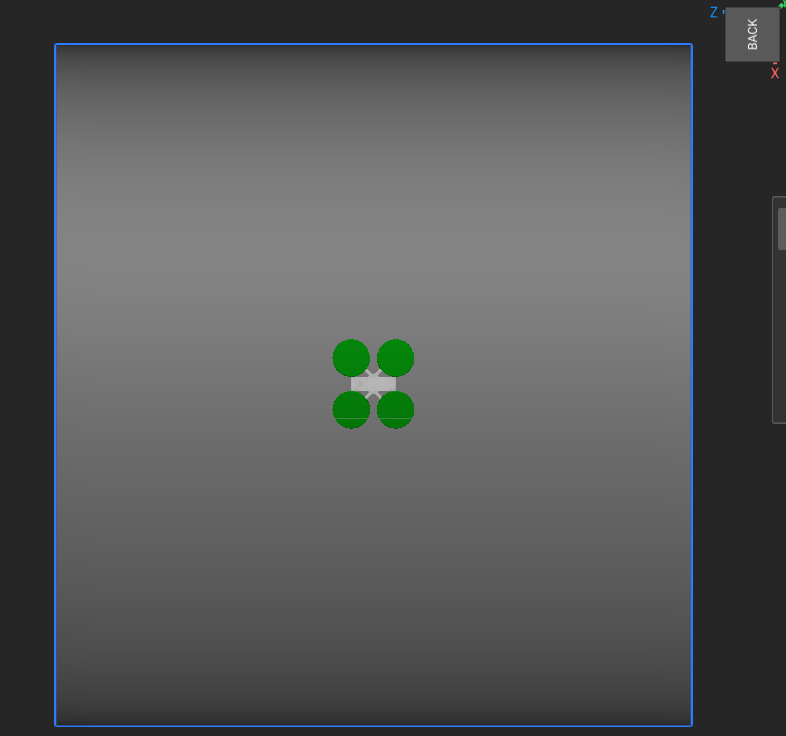
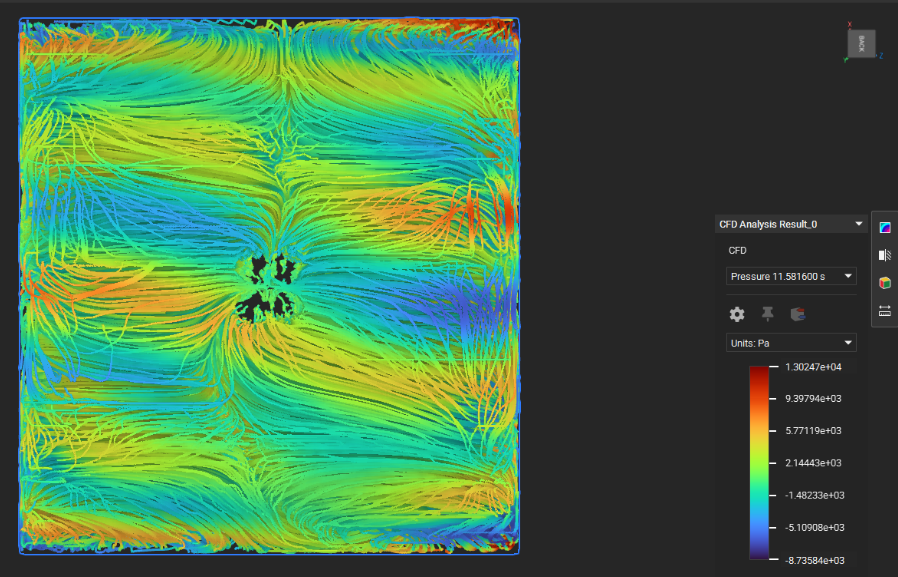
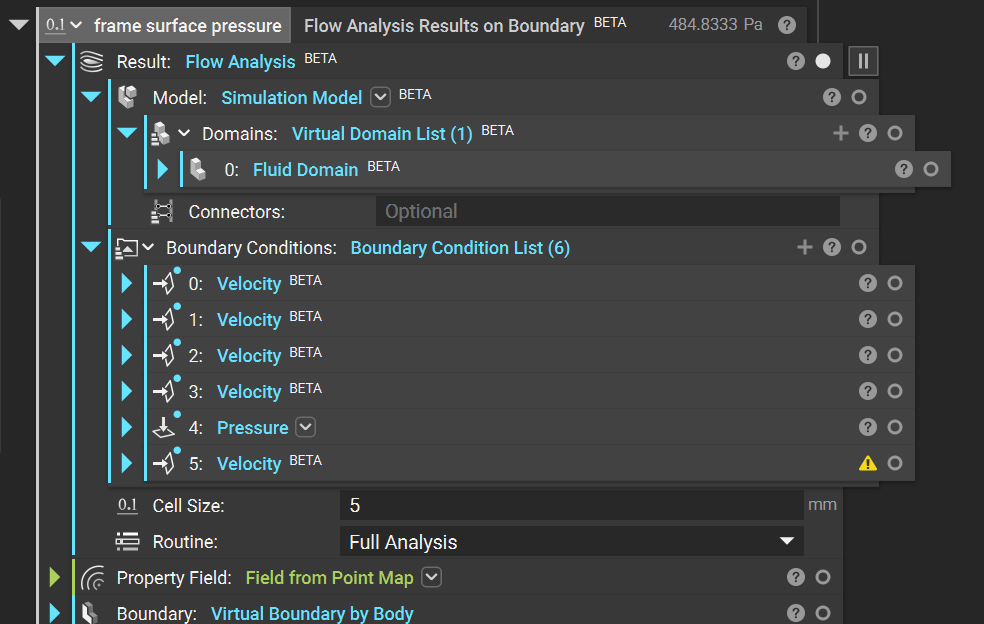
In nTop, I modeled downward airflow through and around the frame using a three-dimensional velocity inlet above it at 24 m/s and a pressure outlet below. The arms, motor mounts, and central body were inside the flow domain. nTop’s implicit, field-based geometry workflow helped handle the complex frame and surrounding domain.
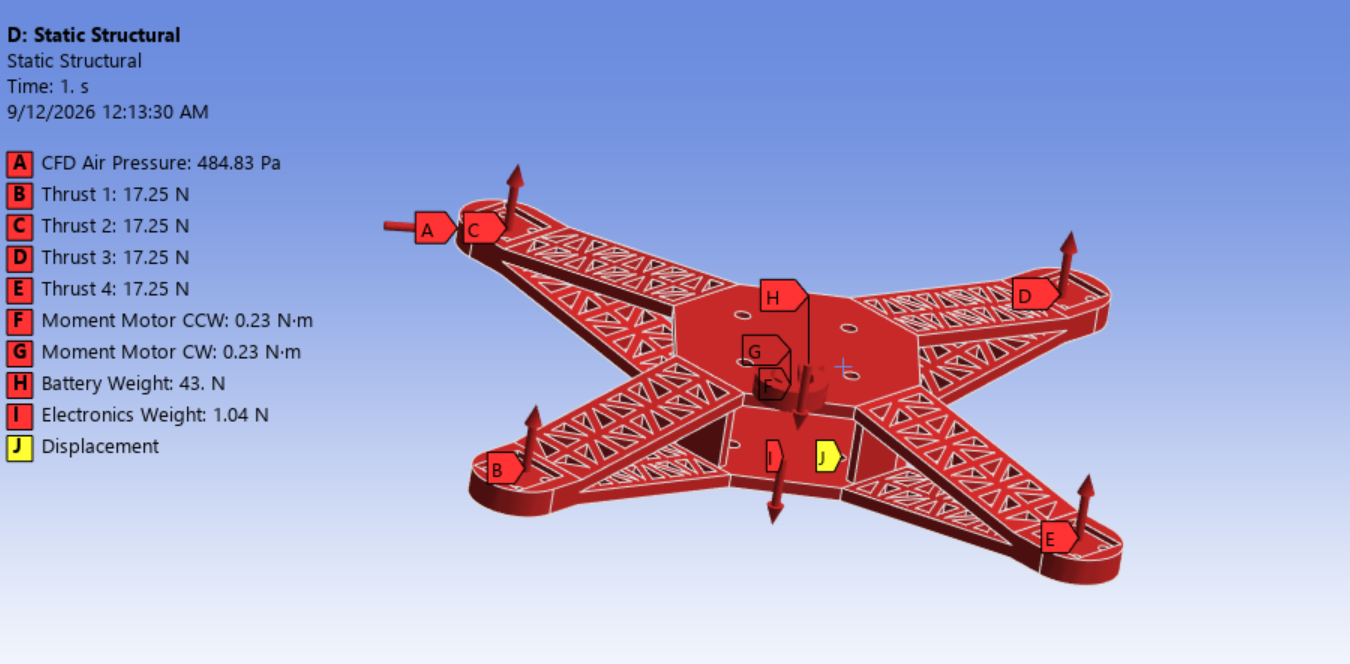
After the CFD run, I used nTop’s Flow Analysis Results by Boundaries to extract the pressure at the frame. The numerical result was 484.833 Pa, rounded here to 484.8 Pa, and supplied the representative frame-pressure load for structural analysis. Motor thrust was a separate input to the ANSYS Mechanical model, alongside reaction torque, component weights, and structural displacement constraints.
| Structural Load | Applied Value |
|---|---|
| CFD-derived frame pressure | 484.833 Pa |
| Motor thrust | 17.25 N per motor · 69.0 N total |
| Motor reaction torque | 0.23 N·m per motor; direction matched propeller rotation |
| Battery weight | 43 N |
| Electronics weight | 1.04 N |
Topology Optimization & Redesign
Turn the load paths into a frame that can be printed and assembled.
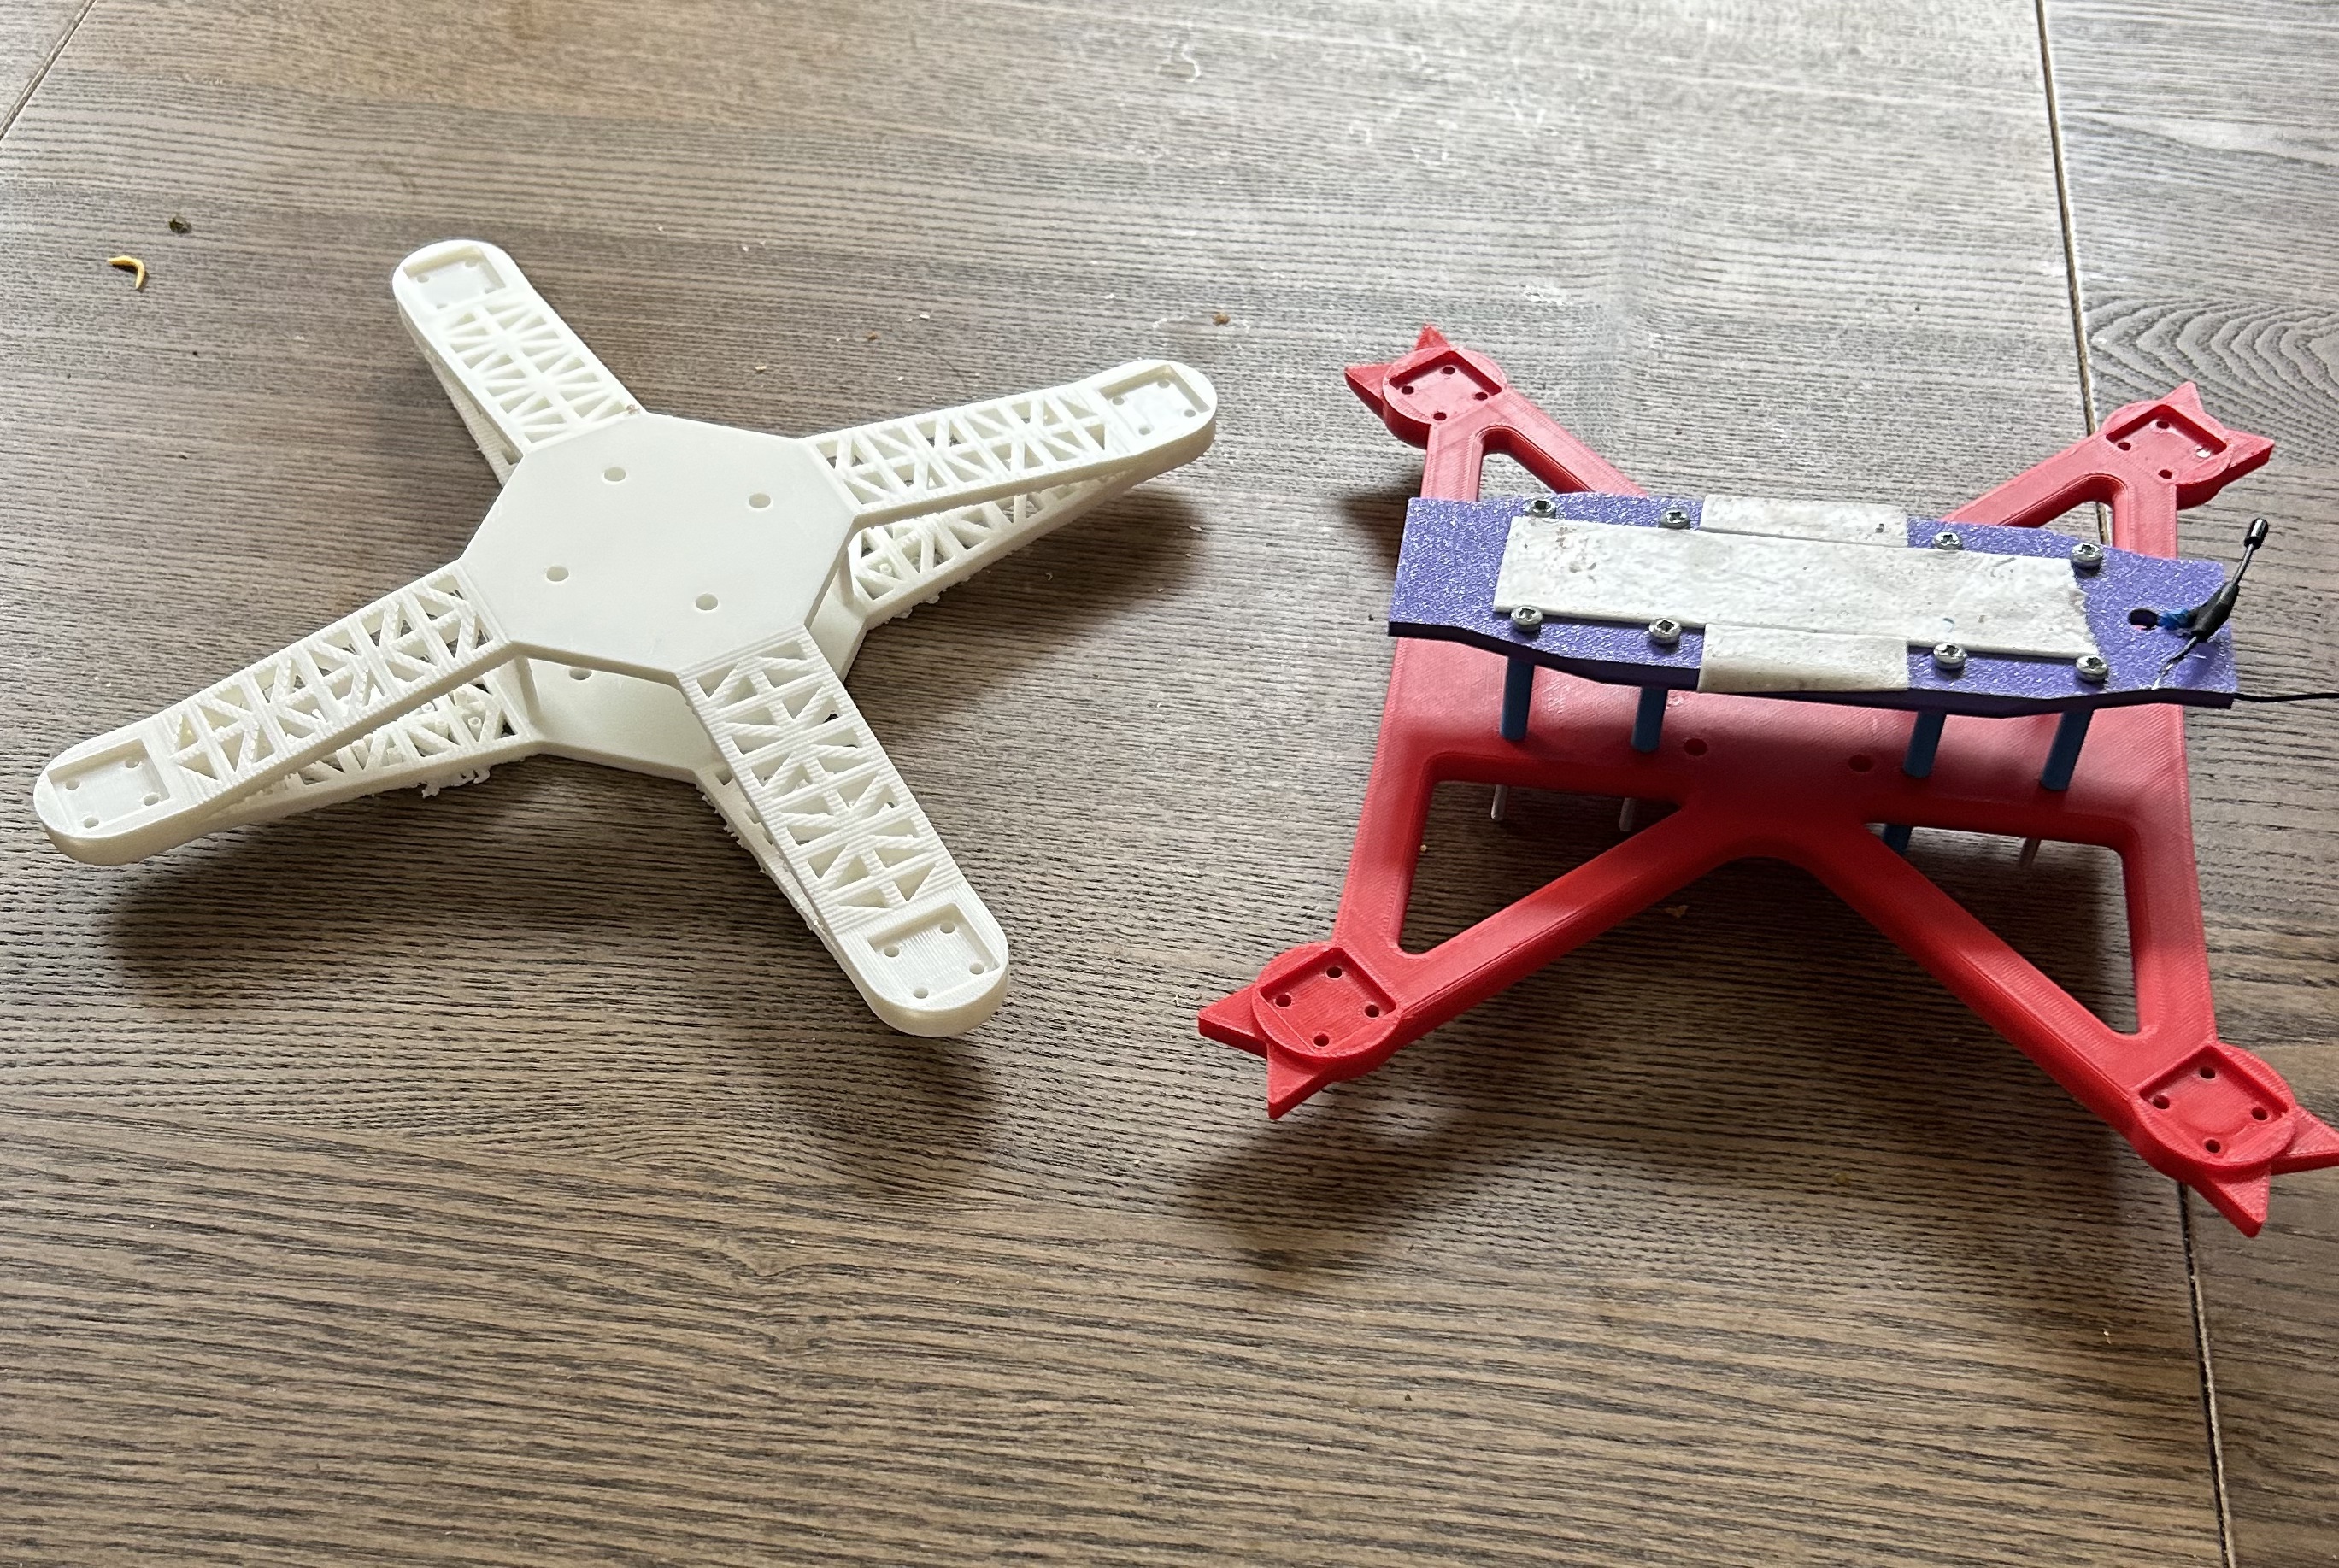
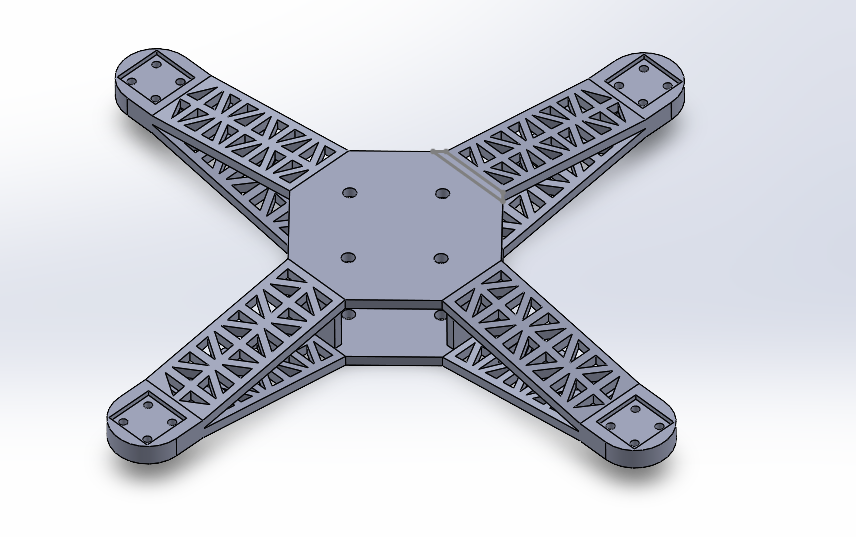
ANSYS topology optimization identified low-utilization material in the baseline frame. I interpreted those results and designed a new manufacturable geometry with truss-like arms, removing material from lower-value regions while preserving the interfaces for motors, electronics, the battery, and flight-control hardware.
The raw topology result was a design guide, not the part sent to the printer. I also reinforced the motor-mount regions to approximately 1.5 times their earlier thickness. The structural results reflect that complete redesign, including local reinforcement and changed geometry.
Structural Verification
33% less frame volume, with lower peak stress in the modeled load case.
Reanalysis reduced peak equivalent von Mises stress from 14.811 MPa to 2.789 MPa, approximately 81%, while frame volume fell by 32.95%. The redesigned frame maintained a factor of safety above 2 under the modeled flight-load case.
| Metric | Baseline | Redesigned |
|---|---|---|
| Frame volume | 139,303.61 mm³ | 93,401.18 mm³ |
| Peak equivalent stress | 14.811 MPa | 2.789 MPa |
| Maximum total deformation | 2.5655 mm | 0.0038198 mm |
| Physical flight test | Successfully flown | Successfully flown |
Baseline maximum deformation occurred near the outer motor regions. The stress and deformation values are simulation results; the successful flights demonstrate that both builds operated, without establishing a measured in-flight stress or deformation correlation. For printed PLA, structural margin also depends on print orientation, layer adhesion, infill, filament, and print settings.
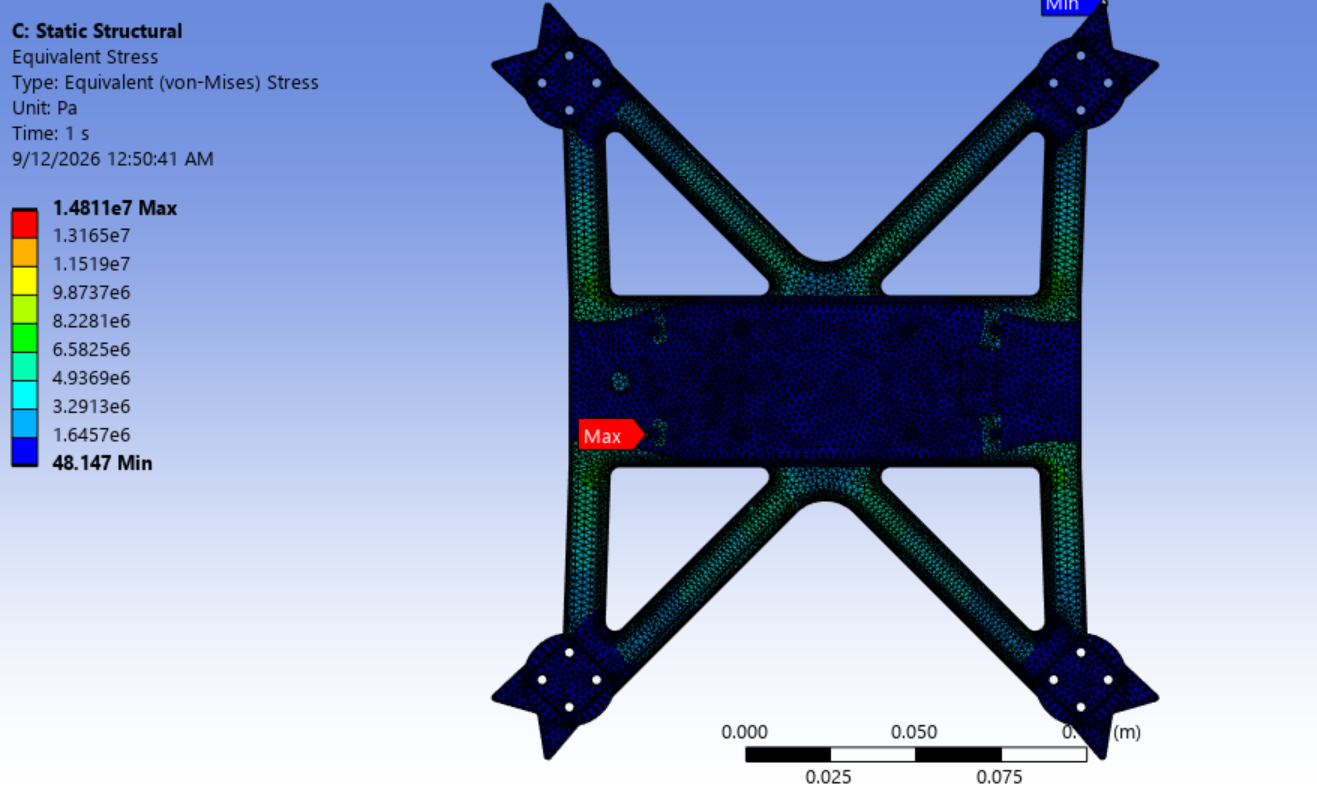
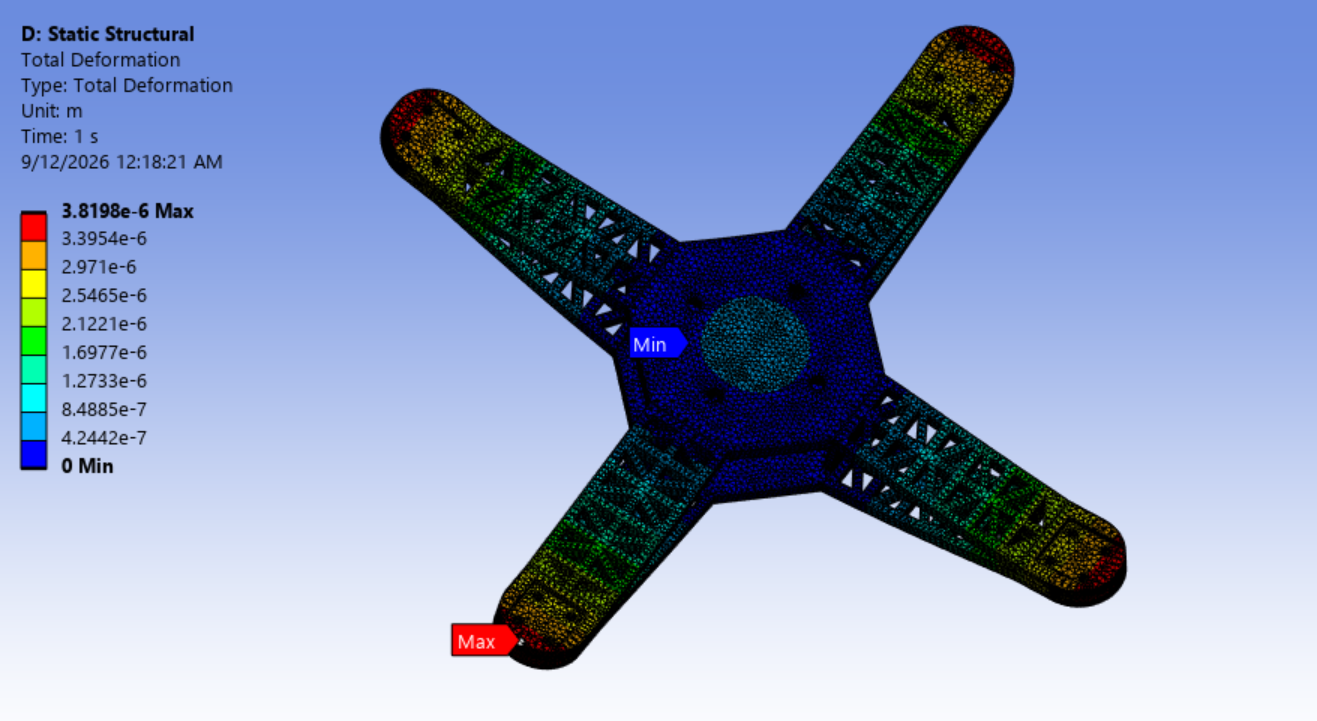
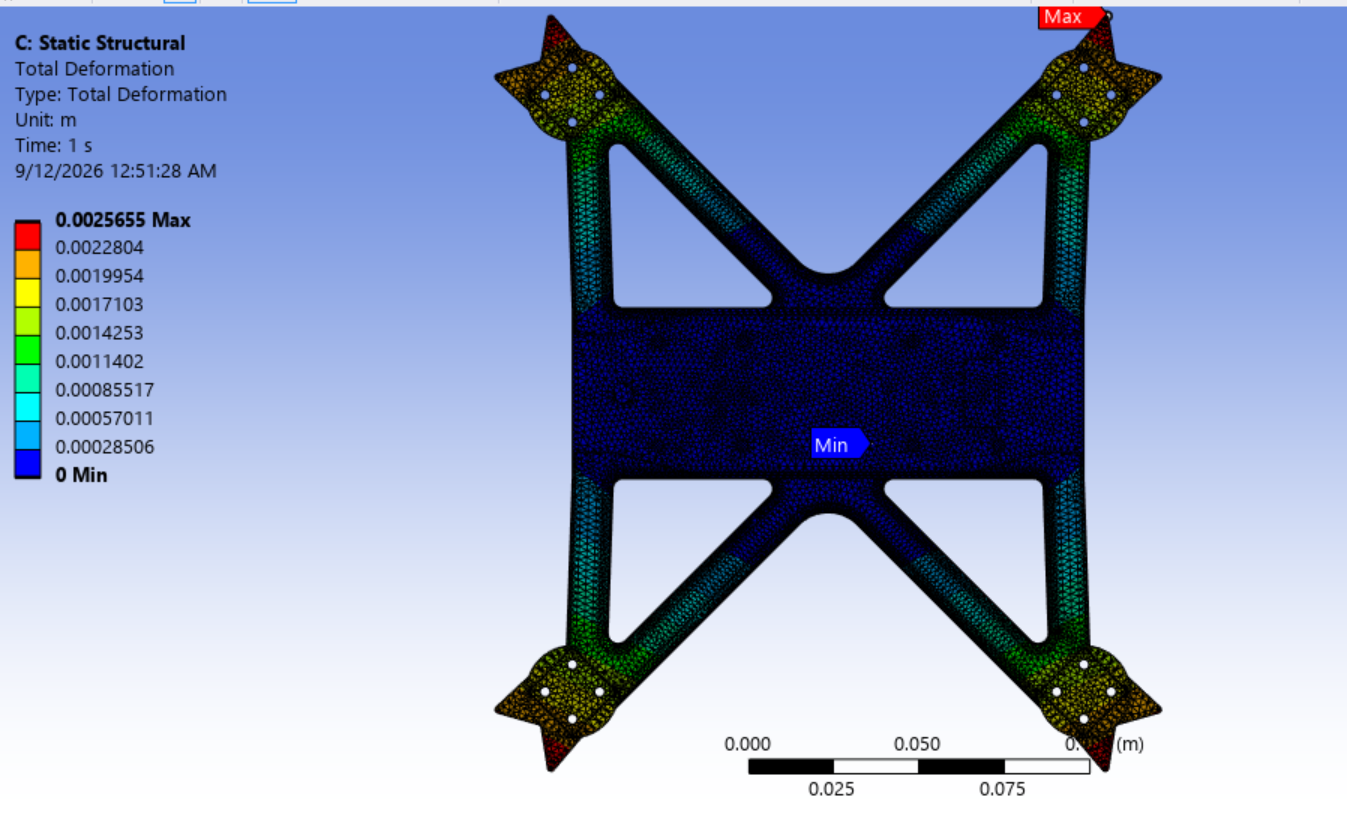
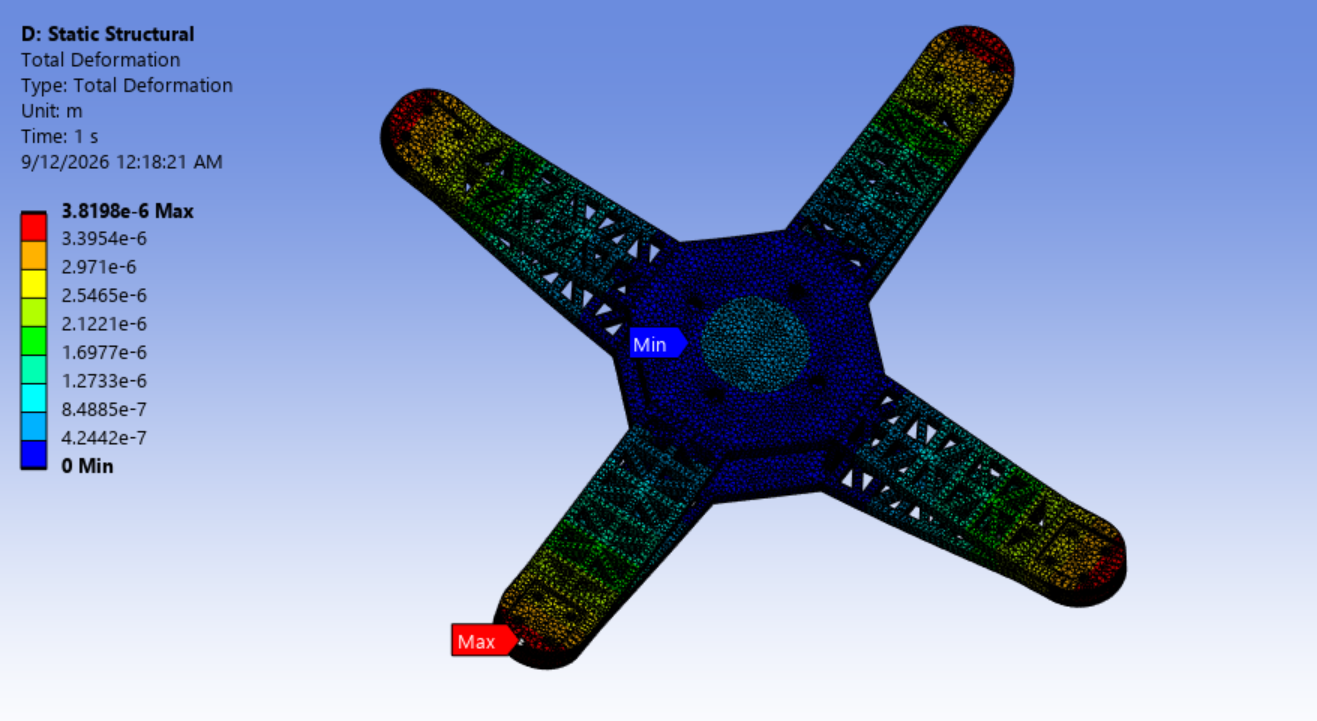
Read each plot’s legend and deformation scale independently; contour colors and displayed shape are not a shared comparison scale.
Stiffness Tradeoff
Lower volume came with reduced torsional stiffness.
A separate stiffness study under 0.23 N·m motor reaction torque showed motor-mount Y rotation increasing from 0.035325° to 0.054888°. Approximate torsional stiffness fell from 373 to 240 N·m/rad, a decrease of about 36%.
The redesigned mount’s rotation remained small at approximately 0.055°, but the reduction in torsional stiffness is an important part of the tradeoff. A separate vertical stiffness study showed lower motor-mount deformation in the redesigned frame. Together, these results show why the redesign needs to be assessed across loading directions rather than judged by peak stress alone.
Hardware Integration & Flight Testing
Print the frame, integrate the flight system, and close the loop in flight.
I built both aircraft iterations from individual components: four brushless motors, 5-inch propellers, a four-in-one BLHeli_32 ESC, an F7 flight controller, an ELRS receiver, a BETAFPV LiteRadio 4 transmitter, and a 6S 22.2 V LiPo battery.
The build included mounting the motors and flight-control hardware; soldering motor wires, ESC and battery connections, the capacitor, and power wiring; and wiring the ELRS receiver. I bound the receiver and transmitter, configured the aircraft in Betaflight, calibrated controls, verified motor response and direction, set up arming, and installed the propellers.
Both the baseline and redesigned frames were successfully flight-tested. The final result was a physically built and flown aircraft with a lower-volume frame, supported by aerodynamic loading estimates, structural analysis, and an explicit assessment of the stiffness tradeoff.